Data Science | K-10
BIG IDEAS
A Selection of Big Ideas from Data Science – from GAISE II (2021).

Formulate statistical investigative questions
- Formulate statistical investigative questions
- Students generate ideas and ask questions – creating and refining statistical investigation questions
Collect/consider data
- Students learn what counts as data (eg visuals, sounds, numbers, categories) and understand that people collect data to answer questions
- Students develop strategies to collect and organize data of various types and from various sources
- Students design studies to answer statistical investigative questions
Analyze data
- Students develop ways to represent and interrogate data to notice, describe and analyze patterns
- Students recognize variability and use technology to develop models that incorporate statistical measures
Interpret and communicate
- Students decide key results to include in a data report that answers the statistical investigative question
- Students communicate their results through, for example, a data visual, a poster, a video, a data story
- Students explore and share explanations, paying careful attention to what conclusions the data supports. They consider which alternatives are reasonable given the variability in findings
What are Data Science K-10 Big Ideas?
Data Science K-10 Big Ideas are descriptions of the most important content in data science through the grades to help focus attention on ways to increase data literacy. Big ideas are those that are central to the discipline of data science, and that link understandings into a coherent whole. (Read Overview)
What are Data Science K-10 Big Ideas?
Data Science K-10 Big Ideas are descriptions of the most important content in data science through the grades to help focus attention on ways to increase data literacy. Big ideas are those that are central to the discipline of data science, and that link understandings into a coherent whole.
Our reason for putting this together is to help teachers see the data science process and how it connects ideas to the content they already teach. We envision teachers teaching content they normally teach and connecting to data science big ideas because our materials help them to see the connections.
How do I use these materials?
Teaching to big ideas in data science means choosing tasks and data talks that give students’ experience inside the big ideas. When teaching to big ideas many different content areas are usually met, as the tasks offer rich learning experiences. (Read Overview)
How do I use these materials?
Teaching to big ideas in data science means choosing tasks and data talks that give students’ experience inside the big ideas. When teaching to big ideas many different content areas are usually met, as the tasks offer rich learning experiences.
Choosing a task that fits different learning goals as well as data science goals is the intent of our materials. The Data Cycle process involves formulating a Statistical Investigation Question (SIQ) that can be answered by data. After a SIQ is developed students move through the process of collecting, considering, and analyzing the data and then interpreting and communicating the results. As students spiral through the data cycle process, they experience many different mathematical connections and learning opportunities. As you and your students experience the data cycle process, we hope you take the methods and move on to other data sets that inspire students’ creativity.
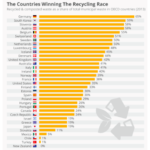
Data Talks can be used daily to support student development in reading and understanding data visuals. Data talks are short 5-10 minute classroom discussions to help students develop data literacy. This pedagogical strategy is similar in structure to a number talk. Instead of a number calculation question students are shown a data visual and asked to notice and wonder. In a data talk the teacher does not have to be an expert in the topic of the data visualization – if a student asks a question, you can say that you do not know the answer but would love to find out, together! This is a nice opportunity to model not knowing and embracing uncertainty. Data talks are intended to pique students’ curiosity and encourage question asking, and to help them understand and “read” the data-filled world in which they live.
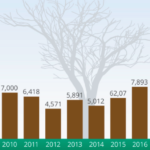
You can also use Data Talks to formatively assess student understanding for an upcoming lesson. For example, if you are teaching linear functions you might use the Melting Arctic Ice data talk since there is a line of best fit displayed on the graph. With younger students you might review the different ways pairs of numbers sum to 10 by using One Through Ten.
Grade K
Big Ideas
Formulate statistical investigative questions
- Develop curiosity through noticing and wondering about data rich situations.
- Generate ideas and ask questions. The teacher helps refine, direct and create statistical investigative questions.
Collect/consider the data
- Consider: What is data? Understand that people collect data to answer questions and that data can vary (eg objects have different colors or sizes).
- Develop strategies to collect and organize data – eg. sort collections of objects into categories that they have chosen.
Analyze
- Develop ways to represent data eg with tally marks, or as pictures or a drawing.
- Notice, describe and analyze patterns.
- Recognize variability by noticing eg different sizes across a collection of items like buttons or blocks.
Interpret and communicate
- Decide key results to summarize from an investigation and answer initial questions.
- Communicate results eg with a data report, a poster, a video.
- Start to make predictions eg: “it will happen, it won’t happen, it might happen”.


Grade K
Additional Details
Teaching Advice
- Statistical Investigative Questions should be developed and refined about a topic students are interested in or have brought up themselves eg. a student wonders if everyone eats pizza. on Friday nights. The teacher then supports the refinement of the question.
- Teachers should be ready to help form questions that can be addressed with data and support the framing of questions that may be used for data collection.
Ethics/Privacy
- Consider fairness and fair share.
- What types of questions are ok to ask in a survey?
Grades 1-2
Big Ideas
Formulate statistical investigative questions
- Develop curiosity through noticing and wondering about data rich situations.
- The teacher helps refine, direct and create statistical investigative questions.
Collect/consider the data
- Learn about what counts as data and understand that people collect data to answer questions, and that data can vary (eg objects have different colors or sizes).
- Work with categorical and numerical (whole number) data.
- Consider and decide: What data will answer my question?
- Collect survey data (eg. favorite pets) or use data given by teacher (eg. ladybug data cards).
Analyze
- Develop ways to represent data as tally marks, drawings, or digitally on a tablet or laptop.
- Students use data visualizations to look for patterns that allow them to make predictions.
- Students notice the likelihood of various outcomes, and variation across them.
- Explore mode — thinking conceptually about the data point(s) that happen the most.
Interpret and communicate
- Decide key results to report that answer students’ initial questions.
- Make a data report: poster, video, news article, etc.
- Make predictions using the terms: “likely, unlikely, certain, and impossible”.
Grades 1-2
Tasks

Lots of Buttons (Coming Soon)
Grades 1-2
Additional Details
Teaching Advice
- Students first have time to be curious and wonder about a situation or given dataset, then this becomes formalized into a research question or a SIQ – with teacher help.
- What are distinct groups? (eg. if we have a group of buttons to sort and create a group for red + round buttons, what do we do with a blue round button?).
- Look on internet for data to answer Statistical Investigative Questions.
- Students use data visualizations to look for patterns that allow them to make predictions (eg. from my class data I think students in another class will like plushies more than trucks).
- Students notice the likelihood of various outcomes, and variation across them (variation that is naturally occurring or induced through study design).
- Decide key results to report that answer students’ initial questions (eg. compare groups).
Ethics/Privacy
- What is privacy? Why is it important?
- What counts as my data? Why should or shouldn’t I share it with others?
- Students learn that we need permission to collect and analyze data about another person.
- Consider fairness and fair share.
Grades 3-5
Big Ideas
Formulate statistical investigative questions
- Develop curiosity through noticing and wondering about data rich situations or given data sets,
- Learn to ask Statistical Investigative Questions that can be answered with data.
- Formulate questions with data collection in mind (wording the question in different ways will give different types of data).
Collect/consider the data
- Understand what counts as data and a data set.
- Understand that we can select certain aspects or subsets of data to be analyzed for a particular purpose.
- Select, design, and conduct a data collection using an appropriate method to answer their SIQ.
- Select and prepare the appropriate variable(s) to answer the SIQ if working with found data.
- Clean data to be analyzable, make sure each entry is formatted correctly and deal with uncertainty in data (missing or incomplete data).
Analyze
- Use data to make predictions.
- Recognize that the reliability and accuracy of predictions depend on many things, e.g. how much data they have and how accurate it is.
- Create different data visualizations then analyze and interrogate them for patterns making sure to take a critical perspective.
- Organize data in ways that show variability and measures of center, using appropriate methods and tools (eg. spreadsheets).
- Explore median and mode, thinking conceptually about the middle of a dataset and/or the data point(s) that happen the most.
Interpret and communicate
- Make a data report as a poster, video, and/or in writing to answer their SIQ.
- Use language that is precise about which groups the results apply, consider whether the results can be applied to other groups.
- Reflect on the data process, what changes could be made, what should be done next?
- Understand how different representations can highlight different aspects of data but that all arguments should be supported by the data and analyses.


Grades 3-5
Additional Details
Teaching Advice
- Questions can start with descriptive questions about 1 variable (eg. students are investigating a photo showing a lot of ladybugs and work to answer, “How many spots do ladybugs typically have?) and extend to comparison questions involving multiple variables (for example Which color of ladybug–black, yellow, red, orange– has the most spots?).”
- Students first have time to be curious and wonder about a situation or given dataset, then this becomes formalized into a research question or a SIQ – with teacher help.
- When starting from a given data set, students should analyze where data has come from, Who collected this data? Why? What might be missing?
- Engage in deep and rich investigations and discussion around the meaning and type of variables, when clustering or regrouping data, are these categories distinct or is there overlap?
- Understand what counts as data and a data set. There are different data types (quantitative, categorical, etc.).
- A dataset can consist of multiple items that have different attributes. (eg. in a spreadsheet, each row represents a different item and each column represents a variable relating to the items).
- Understand that we can select certain aspects or subsets of data to be analyzed for a particular purpose (recognizing that differences from one sample to another are to be expected).
- Allow space for creativity in student generated data visualizations, they do not need to be confined to traditional forms (examples traditional, semi-traditional and nontraditional).
- Organize data in ways that show variability and measures of center, using appropriate methods and tools (eg. spreadsheets).
Ethics/Privacy
- Students learn that we need permission to collect and analyze data about another person.
- Students learn that confidentiality is important. How can we maintain confidentiality?
- What is privacy? Why is it important?
- What counts as my data? Why should or shouldn’t I share it with others?
Grades 6-7
Big Ideas
Formulate statistical investigative questions
- Develop curiosity through noticing and wondering about data rich situations or given data sets.
- Ask statistical investigative questions that compare differences between groups, require a sample of a population, use categorical and numerical data.
- Ask questions of contexts with multiple variables (eg media, social media, science, library, school).
- Formulate questions with data collection in mind recognizing there will be variability within and across samples.
Collect/consider the data
- Design studies and gather data to answer SIQs considering variability and justifying choice of variables.
- Clean data and/or re-code data for consistency.
- Sort, filter, and create features in the data to focus on the appropriate variables for analysis.
- Consider sample type (eg. random sample, convenience sample, etc.), size, count of samples, and how these impact variability.
Analyze
- Understand the notion of chance by considering probabilities of events.
- Create data visualizations to look for patterns or illustrate features of the distribution of the data to answer or help answer their SIQ.
- Understand that some variation within and between samples is determined by chance.
- Make informal inferences about the population(s) based on the findings from the sample.
- Determine and interpret measures of center (including mean, median, and mode) selecting the appropriate measure to answer the SIQ.
- Understand standard deviation, through visual models.
Interpret and communicate
- Create a data report (poster, presentation, video, write-up) that answers the SIG and focuses on what the audience should take away.
- Explore and share competing explanations for data trends observed. Consider which alternatives are reasonable given the variability in findings.
Grades 6-7
Tasks


Grades 6-7
Additional Details
Teaching Advice
- When looking at visualizations highlight shape of distributions, linear correlation, measures of center and spread.
- Make sure to assess whether claims are directly supported by the data and analysis.
- Create visuals, presentations, written reports, etc., that communicate the findings from the data, paying careful attention to clear and precise word choice (avoid casual claims if the data does not support them. eg instead of “each 4 foot increase in max height of the roller coaster results in a 1 mph increase in the max speed ” students say: “ on average a 4 foot increase in max height of the roller coaster is associated with a 1 mph increase in the max speed.”
- Clean data and/or re-code data for consistency, deal with the uncertainty around missing or questionable data and reflect eg. missing at random or missing through a deliberate process that will induce bias.
Ethics/Privacy
- Students learn that we need permission to collect and analyze data about another person.
- Students learn that confidentiality is important. How can we maintain confidentiality?
- Consider what we can and cannot/should not do with other people’s data.
- What is bias? Why do we want to avoid bias?
Grades 8-10
Big Ideas
Formulate statistical investigative questions
- Develop curiosity through noticing and wondering about data rich situations or given data sets.
- Formulate statistical investigative questions and/or pose hypotheses. These include questions about variation or the differences between groups, associations between numerical variables, and/or questions that require pairing together multiple analyses or measures to answer.
- Ask questions of contexts with multiple variables (eg media, social media, science, library, school).
Collect/consider the data
- Select and design appropriate studies given the question(s) and context.
- Learn there are many choices to be made around the process of data collection and these affect the quality, amount, speed, accessibility, and cost of the data collection.
- Clean, organize, and prepare data for analysis, including addressing/removing incorrect data, sub-setting, filtering, creating new variables or composite measures.
Analyze
- Develop an understanding of the notion of a statistical model, consider linear, exponential, or power functions as models.
- Consider correlation between variables (make a clear distinction between correlation and causation), Fit regression models, examine residuals, make associations within multivariable datasets.
- Make inferences or predictions based on analyses, recognizing that the accuracy depends on the model and the data used to build the model.
- Create and analyze graphs and other data visualizations for associations between two or more variables.
- Test hypotheses.
Interpret and communicate
- Answer the statistical investigative question(s).
- Explore competing explanations for the data trends observed (ex. confounding variables); paying careful attention to what conclusions the data supports.
- Interpret measures such as slope of line of best fit in context, correlation coefficients and strength of association.
- Develop presentations for different community groups, responding to differing arguments or interpretations of the data.
Grades 8-10
Tasks

Grades 8-10
Additional Details
Teaching Advice
- Understand the issues of bias and confounding variables in observational studies and their implications for interpretation.
- Use the key features of distributions for quantitative variables, such as: center: mean as a balance point, and median as the middle-ordered value variability: interquartile range and mean absolute deviation (MAD)shape: symmetric or asymmetric and number of modes.
- Study designs include: surveys, observational studies, experimental studies, randomized controlled studies.
Ethics/Privacy
- Understand that limited datasets can result in biased models.
- Before engaging with a data set, consider if it is a fair representation of the group it presents, what is missing? Whose perspective is missing?
- Consider what we can and cannot/should not do with other people’s data.
- What is bias? Why do we want to avoid bias?
With Thanks
With thanks to the people who gave feedback on the big ideas:
Dr. Pip Arnold
Director at Karekare Education, New Zealand
Dr. Denise Spangler
Dean of Mary Frances Early College of Education
University of Georgia, USA
Woodside School Video and Lesson Plan
Our thanks to the teachers from Woodside school for their help with the ideas.

Dr. Jo Boaler
Stanford Professor

Dr. Rob Gould
UCLA Professor

Cathy Williams
Cofounder YouCubed@Stanford

Dr. Steve Levitt
University of Chicago Professor

Tanya LaMar
Doctoral Student

Jack Dieckmann
YouCubed Research Director

Jesse Ramirez
Doctoral Student

Megan Selbach-Allen
Doctoral Student
References
Arnold, P., & Franklin, C. (2021). What Makes a Good Statistical Question?. Journal of Statistics and Data Science Education, 29(1), 122-130.
Bargagliotti, A., Franklin, C., Arnold, P., Gould, R., Johnson, S., Perez, L., & Spangler, D., (2020). Pre-K – 12 Guidelines for Assessment and Instruction in Statistics Education II (GAISE II): A Framework for Statistics and Data Science Education. Retrieved from: https://www.amstat.org/asa/files/pdfs/GAISE/GAISEIIPreK-12_Full.pdf
K-12 Computer Science Framework Steering Committee. (2016). K-12 Computer Science Framework. ACM. Retrieved from: https://k12cs.org/
Seehorn, D., & Clayborn, L. (2017, March). CSTA K-12 CS Standards for All. In Proceedings of the 2017 ACM SIGCSE Technical Symposium on Computer Science Education (pp. 730-730).